
Netdata is architected on every level, across both the open-source Netdata Agent and Netdata Cloud, to help you own every layer of your monitoring experience. With this design, all metrics data collected by the Netdata Agent stays distributed on your node, but you also leverage Netdata Cloud’s dashboards and multi-node visualizations to view the health and performance of an entire infrastructure from a single application.
For example, the composite charts in the Overview dashboard query every node in a given War Room, stream returned metrics data to Netdata Cloud, and proxy the aggregated values/charts to your browser. You own your data, but your infrastructure monitoring is centralized, holistic, and easy to manage.
We’re happy to announce a new major step toward centralizing how Netdata Cloud users view and react to anomalies or incidents on any node in their infrastructure. Centralized alarm notifications are now available for every Netdata Cloud user or team, for free, regardless of the number of users or nodes.
Many nodes, a single switch for centralized infrastructure truth
Netdata Cloud always displayed active alarms from any number of nodes, but until now, never provided a “single source of truth” for being notified about those alarms. If you wanted to receive email notifications, you had to configure each node’s notifications system, which, based on the type of infrastructure you manage, could require a lot of per-node configuration withedit-config, role management, and installing sendmail on nodes that otherwise have no business sending email.Centralized alarm notificationsdramatically simplifies that process. Instead of configuring each node individually, Netdata Cloud simply references the list of active alarms and generates notifications for any troublesome node in your Space. It’s entirely zero-configuration and works with any type of alarm coming from the Netdata Agent, whether preconfigured or highly customized for your infrastructure. And you can enable notifications in just a few clicks.To follow the paradigm from the beginning of the post: You own your metrics data, you manage your nodes’ health entities, but you get notified of their health status in one place. You have a single source of truth that keeps your team informed, aligned, and focused on resolving issues.
Space administrators can enable centralized alarm notifications in a few clicks and a single toggle switch.
The default is to receive all types of notifications—critical, warning, and clear, plus notifications when nodes go into an unreachable state—but individual users have access to powerful management options for when and how they want to receive alarm notifications. Specify, per War Room, whether you’d like to receive all alarms, critical alarms only, or nothing at all. Craft a centralized notification platform that’s tailored to the exact needs of your infrastructure, or the makeup of your team. Own your metrics data and your alarm notification engine.
For now, Netdata Cloud supports centralized alarm notifications via email, and we’ve built in flood protection to ensure you don’t hit that dreaded notification fatigue for nodes that tend to “flap” between states. You only get emails when there’s a real issue on your infrastructure.
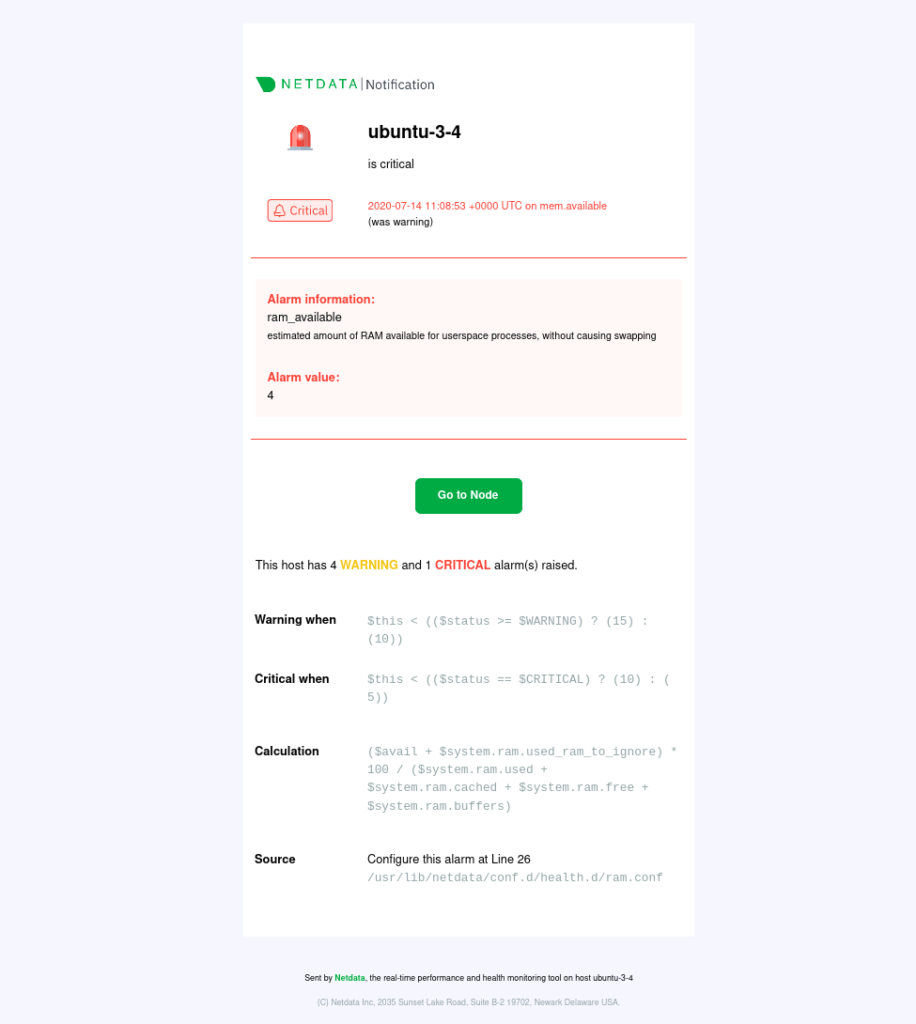
An example centralized alarm notification email from Netdata Cloud.
Centralized alarm notifications are disabled by default for all existing Spaces and users—read our documentation for more details for enabling notifications for both your Space and individual user profile.
Reduced memory and new ML-driven truths in Netdata Agent v1.27
Our last major Netdata Agent release of the year, deployed in parallel with centralized alarm notifications in Netdata Cloud, is focused heavily on quality-of-life improvements, including dozens of bug fixes, improvements, and a handful of new collectors written in Go.We migrated host, chart, and dimension metadata to SQLite to reduce the memory footprint of the Agent itself and make it launch faster. A new extent cache also improves query time by 10% under certain workloads and reduces disk I/O by 10%.
A few of those improvements are also powerful new ways of discovering deeper and more precise truths about your nodes.
View specific timeframes with the time & date picker
Before v1.27, if you wanted use the Netdata Agent dashboard to see a timeframe of 5 minutes beginning precisely at 2:48 a.m. last Wednesday, you had to manually zoom out, pan back through days worth of real-time metrics, then zoom back in until the timestamps matched exactly what you needed. The new time & date picker helps you select precise timeframes for deep analysis, whether you’re working alone or in a team. Get aligned, drill down, and start managing incidents faster.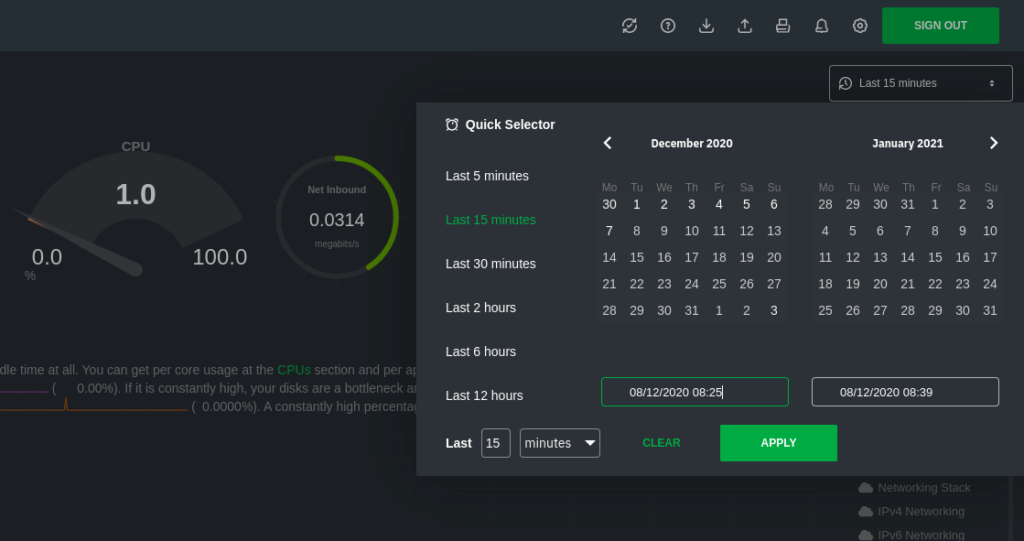
The new time & date picker in the Netdata Agent.
Embedded anomaly detection to help you troubleshoot
The Netdata Agent is now capable of unsupervised anomaly detection. The anomalies collector runs atrain function that learns what “normal” looks like on your node, followed by a predict function to apply trained ML models against recent metrics to produce charts for anomaly probability per configured chart/dimension (0 = no anomaly, 1 = active anomaly) and the volume of active anomalies.To demo the value of the anomalies collector, create stress on a node with stress-ng --all 2. Both the Anomaly Probability and Anomaly charts light up with high probabilities and likely probability flags and a spike in active anomalies.
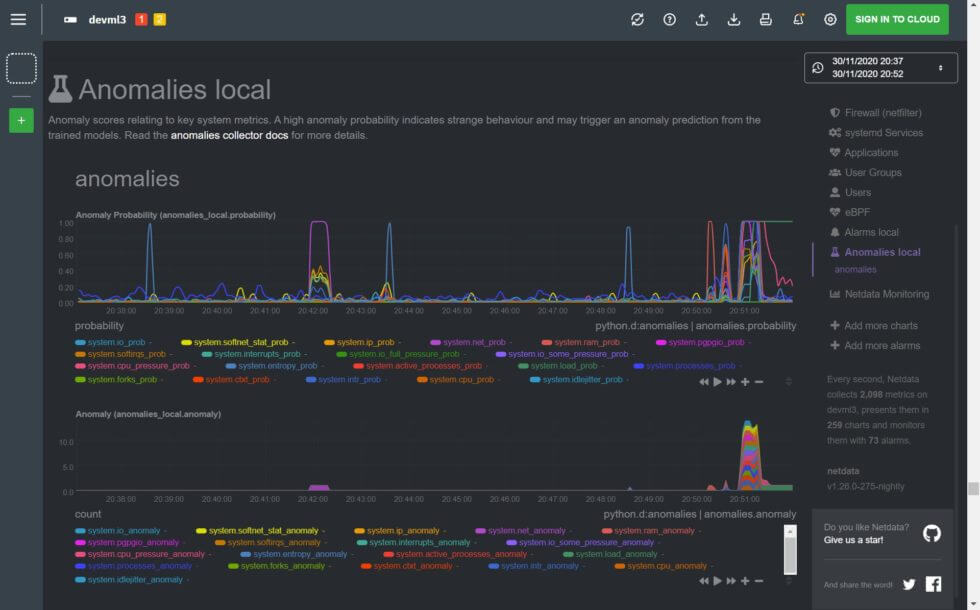
If you’re using the anomalies collector on an active, production node undergoing some kind of incident, use the flagged charts/dimensions in the anomalies.anomaly chart as your first steps when troubleshooting. Based on the ML models of your node’s baseline, these charts are most likely to be the root cause.
Once you deploy a fix (stopping the stress-ng process, in this case), the anomalies settle as the node returns to its healthy baseline state.
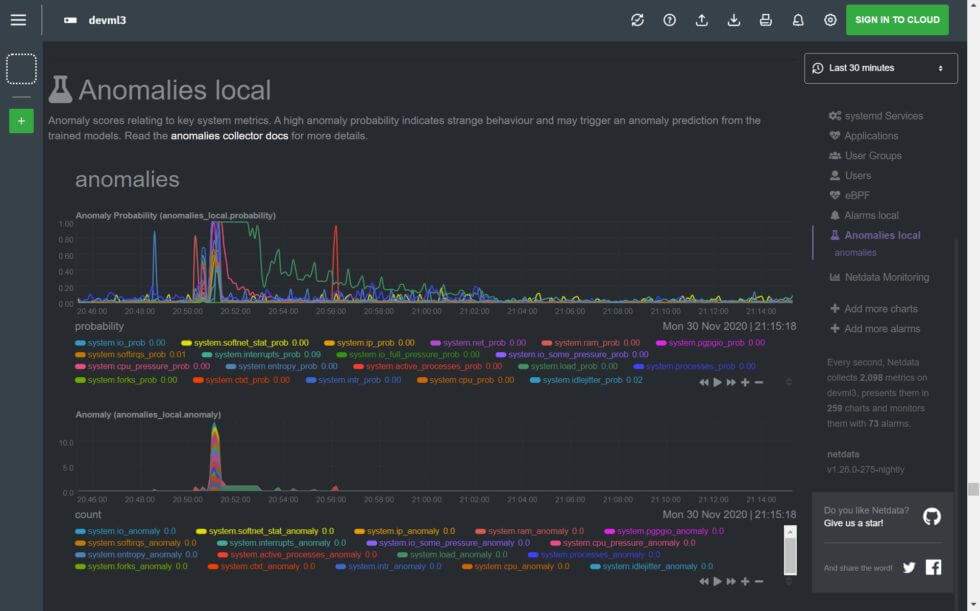
The new anomalies collector requires a bit more setup than most of our collectors, including installing some Python packages with pip, but we’ve outlined the whole process in our documentation. We’re really excited to see how users apply Netdata’s embedded anomaly detection, both in the Agent and Netdata Cloud.
What’s next?
While both our Netdata Agent and Cloud teams (and the ambitious few who work cross-functionally!) are looking forward to a few calm weeks to round out 2020, they’re also hard at work on exciting new features to come in 2021. Look out for another post with a roundup of everything the Netdata team has accomplished in 2020, from new features to the sheer number of commits to the Netdata Agent repository.Our sincere gratitude goes out to all those who contributed to v1.27 of the Netdata Agent! If you’re interested in contributing to the Netdata Agent, read our contributing page on Netdata Learn, which directs you to specific projects and guidelines, or head over to the Netdata community forums where we can help focus your passion into a meaningful project.
Check out the release notes on GitHub for a changelog of every bug fix and improvement.
