
This is the the last of a 2-part blog post series regarding Netdata and Geth. If you missed the first, be sure to check it out here.
Geth is short for Go-Ethereum and is the official implementation of the Ethereum Client in Go. Currently it’s one of the most widely used implementations and a core piece of infrastructure for the Ethereum ecosystem.
With this proof of concept I wanted to showcase how easy it really is to gather data from any Prometheus endpoint and visualize them in Netdata. This has the added benefit of leveraging all the other features of Netdata, namely it’s per-second data collection, automatic deployment and configuration and superb system monitoring.
The most challenging aspect is to make sense of the metrics and organize them into meaningful charts. In other words, the expertise that is required to understand what each metric means and if it makes sense to surface it for the user.
Note that some metrics would make sense for some users, and other metrics for others. We want to surface all metrics that make sense. When developping an application, you need much lower level metrics (e.g eBPF), than when operating the application.
Let’s get down to it.
A note on collectors
First, let’s do a very brief intro to what a collector is.
In Netdata, every collector is composed of a plugin and a module. The plugin is an orchestrator process that is responsible for running jobs, each job is an instance of a module.
When we are “creating” a collector, in essence, we select a plugin and we develop a module for that plugin.
For Geth, since we are using the Prometheus Endpoint, it’s easier to use our Golang Plugin, as it has internal libraries to gather data from Prometheus endpoints.
The following image is useful:
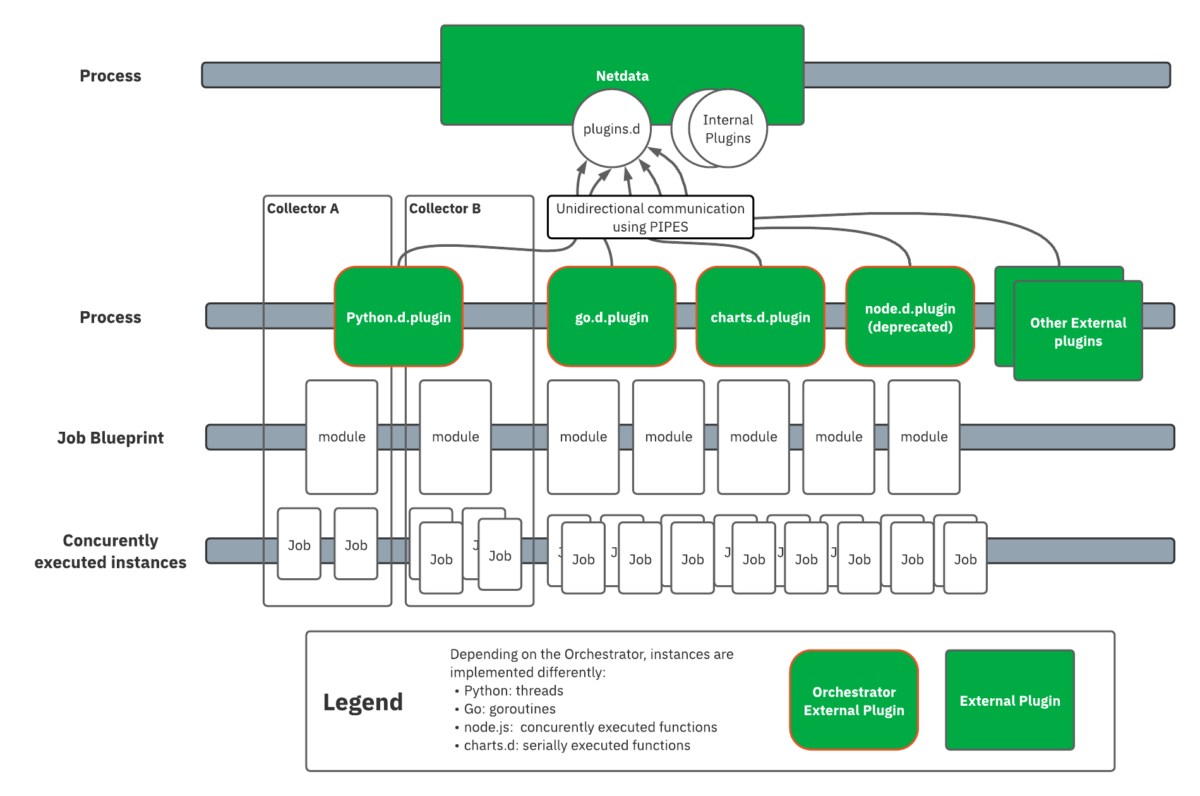
If you want to dive into the Netdata Collector framework:
Geth collector structure
So, in essence, the Geth collector is the Geth module of the Go.d.plugin.
As you can see on GitHub, the module is composed of four files:
charts.go: Chart definitionscollect.go: Actual data collection, using the metric variables defined inmetrics.gogeth.go: Main structure, mostly boilerplate.metrics.go: Define metric variables to the corresponding Prometheus values
How to extend the Geth collector with a new metric
It’s very simply, really.
Open your Prometheus endpoint and find the metrics that you want to visualize with Netdata.
e.g p2p_ingress_eth_65_0x08
Open metrics.go and define a new variable
e.g const p2pIngressEth650x08 = "p2p_ingress_eth_65_0x08"
Open collect.go and create a new function, identical to the one that already exist. Although it doesn’t really makes a difference in our case, we strive to organize the metrics into sensible functions (e.g gather all p2pEth65 metrics in one function). This is the function that we will do any computation on the raw value that we gather.
Note that Netdata will automatically take care of units such as bytes and will show the most human readable unit in the dashboard (e.g MB, GB, etc.)
e.g
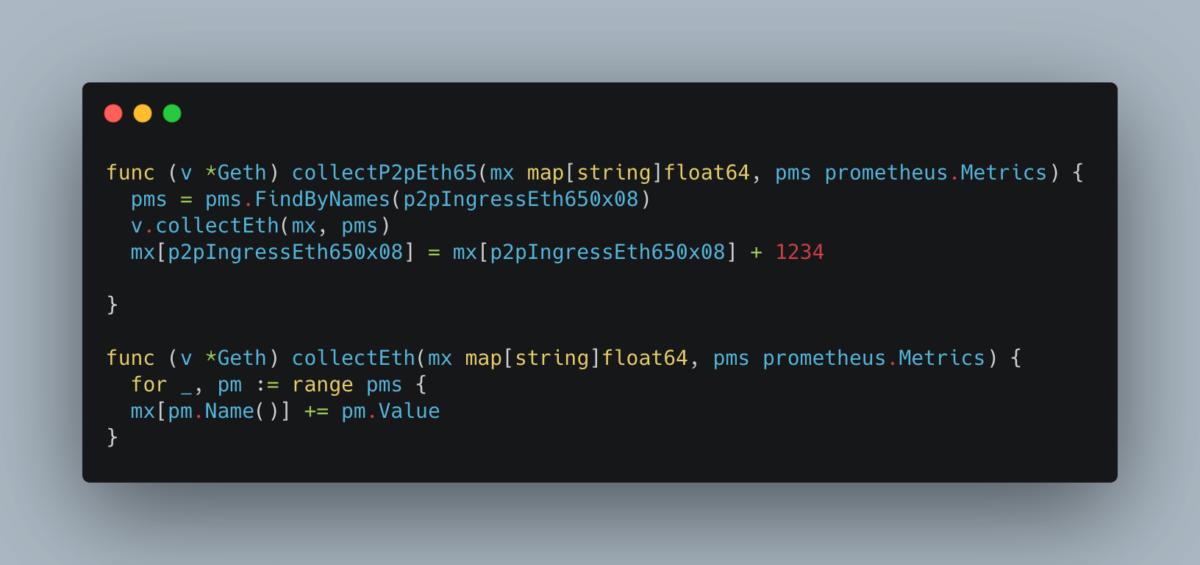
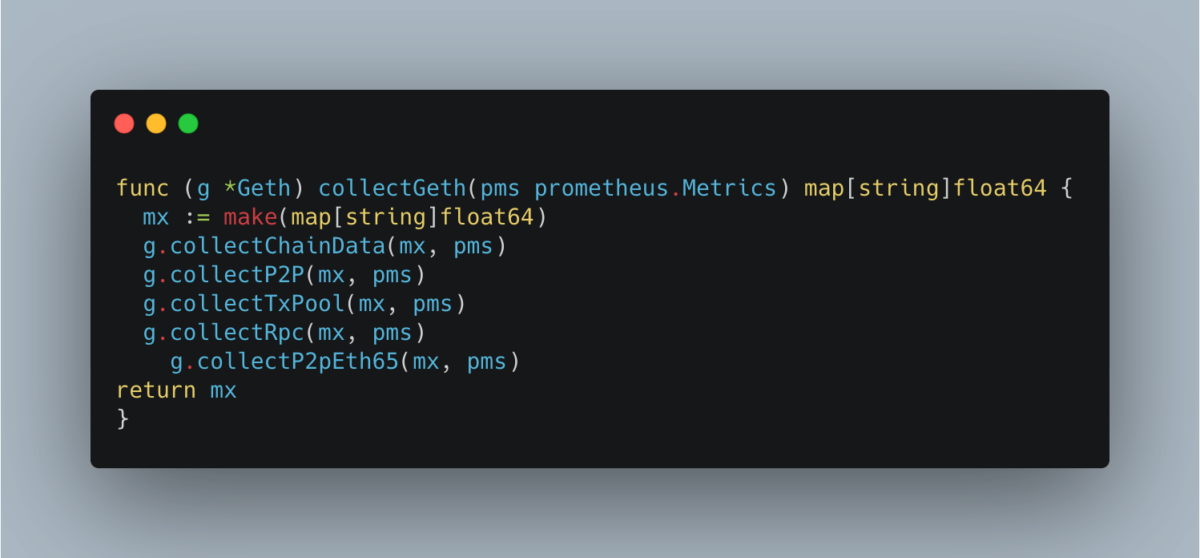
We also need to add the function in the central function that is called by the module at the defined interval.
Lastly, now that we have the value inside the module, we need to create the chart for that value. We do that in charts.go:
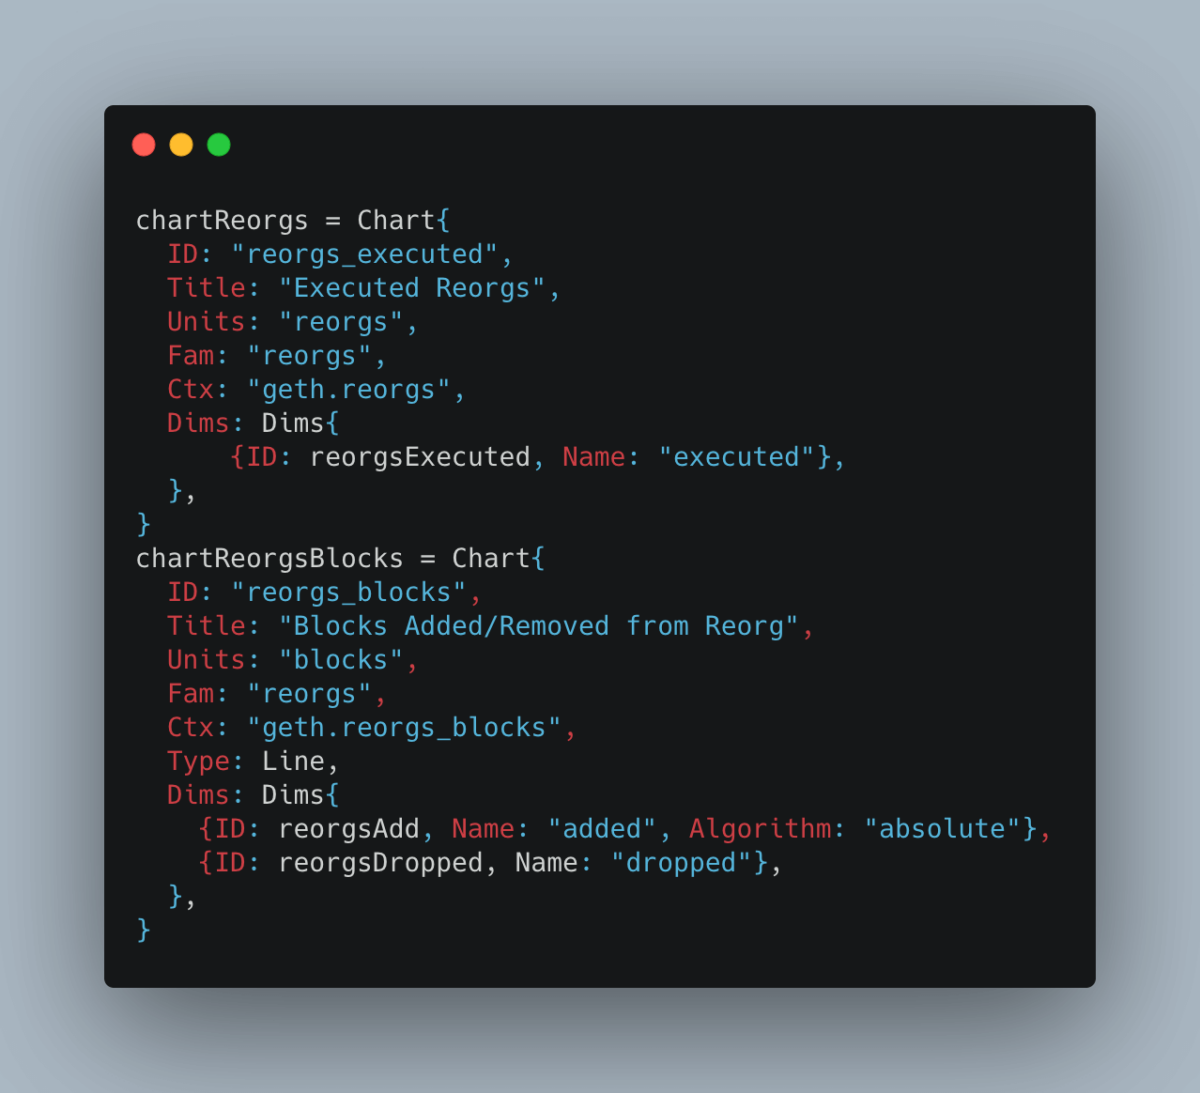
Let’s explain the fields of the structure:
ID: The unique identification for the chart.Title: A human readable title for the front-end.Units: The units for the dimension. Notice that Netdata can automatically scale certain units, so that the raw collector value stays inbytesbut the user seesMegabyteson the dashboard. You can find a list of supported “automatically scaled” units on this file.Fam: The submenu title, used to group multiple charts together.Ctx: The identifier for the particular chart, kinda like id. Use the convention<collector_name>.<chart_id>.Type:Line(Default) orAreaorStacked.Areais best used with dimensions that signify “bandwidth”.Stackedwhen it make sense to visually observe thesumof dimensions. (e.g thesystem.ramchart is stacked).Dims:ID: The variable name for that dimension.Name: human readable name for the dimension.Algorithm:absolute: Default (if omitted) isabsolute. Netdata will show the value that it gets from the collector.incremental: Netdata will show the per-second rate of the value. It will automatically take the delta between two data collections, find the per-second value and show it.percentage: Netdata will show the percentage of the dimension in relation to thesumof all the dimensions of the chart. If four dimensions have value =1, it will show25%.Mul: Multiply value by some integer.Div: Divide value by some integer.
A final note on extending Geth
The prometheus endpoint is not the only way to monitor Geth, but it’s the simplest.
If you feel adventurous, you can try to implement a collector that also uses Geth’s RPC endpoint to pull data (e.g show charts about specific contracts in real time) or even Geth’s logs.
To use Geth’s RPC endpoint with Golang, take a look at Geth’s documentation.
To monitor Geth’s logs, you can use our weblog collector as a template. It monitors Apache and NGINX servers by parsing their logs.
Add alerts to Geth charts
Now that we have defined the new charts, we may want to define alerts for them. The full alert syntax is out-of-scope for this tutorial, but it shouldn’t be difficult once you get the hang of it.
For example, here is a simple alarm that tells me if Geth is synced or not, based on whether header and block values are the same:
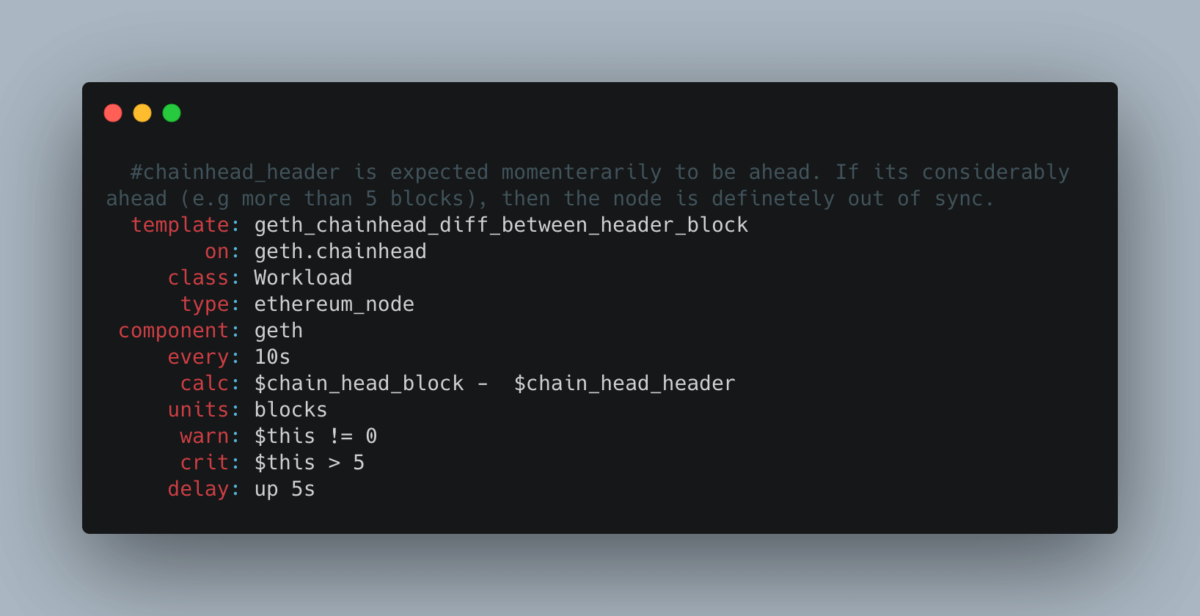
geth.chainhead (thus all the Geth nodes that we may monitor with a single Netdata Agent), every 10s, caluclate the difference between the dimensions chain_head_block and chain_head_header. If it’s not 0, then raise alert to warn. If it’s more than 5, then raise to critical.Some useful resources to get you up to speed quickly with creating alerts for our Geth node:
Note that if you create an alert and it works for you, a great idea is to make a PR into the main netdata/netdata repository. That way, the alert definition will exist in every netdata installation, and you will help countless other Geth users.
Here are some useful resources to create new alerts:
- Youtube – Creating your first health alarm in Netdata
- Docs – Configure health alert
- Docs – alert configuration reference
- Docs – Enable alert notifications
Extend Geth collector for other clients
The beauty of this solution is that it’s trivial to duplicate the collector and gather metrics from all Ethereum clients that support the Prometheus endpoint:
The only difference between a Geth collector and a Nethermind collector is that they might expose different metrics or the same metrics with different “Prometheus metrics names”. So, we just need to change the Prometheus metrics names in the metrics.go source file and propagate any change to the other source files as well.
The logic that I described above stays exactly the same.
In conclusion
Extending Geth for more metrics is trivial.
As you may suspect, this guide is applicable for any data source that is exposing it’s metrics using the Prometheus format.
