In case you missed it, we released an all-new version of Netdata Cloud in May. Netdata Cloud is a free service that can be accessed from any browser and provides you with a consolidated view of your entire infrastructure.
Netdata Cloud works differently from other monitoring solutions. Most solutions limit the number and frequency of metrics because they rely on architectures that aggregate data. Netdata Cloud, however, streams limited metadata from each node running the Netdata Agent, keeping you in control of the data on your systems. The advantage of this architecture is that there is no limit to the number or frequency of metrics, regardless of the scale or complexity of your IT infrastructure. You can truly monitor every metric, from every system and application, across your entire infrastructure, in real time. For free.
The other core difference between Netdata and other IT infrastructure monitoring solutions is that Netdata doesn’t require any advanced planning or resources. The Netdata Agent is extremely lightweight and can be permanently installed on any system, container, VM, or IoT device without causing any degradation in performance. It takes minutes to install with zero configuration required and comes with service auto-discovery to help you start to visualize metrics instantly. Adding something new to your infrastructure? Throw Netdata Agent on there, claim the node to your Netdata Cloud account, and monitor it seamlessly alongside the rest of your infrastructure from a single pane of glass. With more than 200 turnkey integrations, Netdata is the fastest, easiest way to start troubleshooting.
Let’s take a look at some key features and benefits.
See your entire infrastructure at a glance
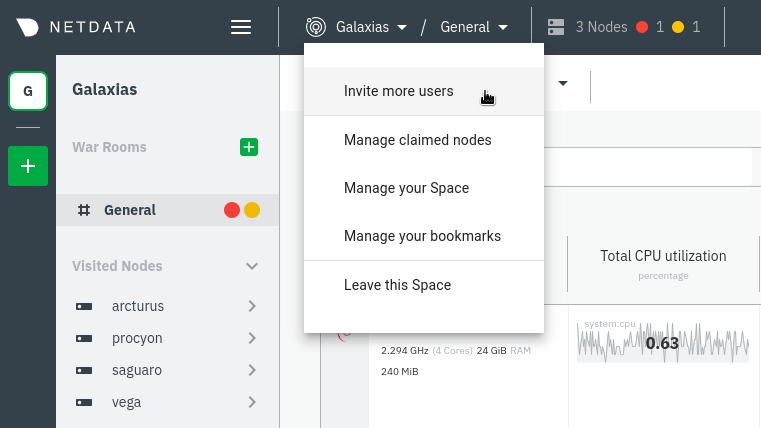
The core benefit of Netdata Cloud is to help you get a view across more than one node running the Netdata Agent without having to log into each system. Just create a free Netdata Cloud account, then claim your existing nodes running Netdata Agent. This is a secure way to add each system to Netdata Cloud so that you can view any metrics in real time from the same place. You can also use Netdata Cloud to remotely log in to those nodes later if required for further troubleshooting or analysis. Invite your team to collaborate, and organize your infrastructure to make monitoring and troubleshooting easy.It only takes minutes to get started:
- Create your free Netdata Cloud account
- Connect your nodes running Netdata Agent
- Invite your team to Netdata Cloud to start working together
Organize troubleshooting and monitoring workflows
Netdata Cloud was designed to make it easy for individuals within the same team to collaborate and for different teams within the same organization to work independently in parallel. Key concepts for organizing your infrastructure view are War Rooms and Spaces.War Rooms
War Rooms are where users can view metrics and monitor nodes with their alarm status. War Rooms are the basic unit of organization for your nodes. You can group them by different things to make it easier to quickly identify and isolate issues. For example, you can set up War Rooms by service or application (like all your web services in one place), physical location, bare-metal or container, cloud provider, or more. This enables you to see slices of your infrastructure at a glance by moving from one War Room to another. Other ideas for War Rooms include monitoring specific apps or services end-to-end across the whole stack, or setting up a War Room specifically for incident response, often as the first step of the process.Spaces
Spaces are workspaces for you to organize team members and the nodes that they’re able to view in each War Room. You can use any number of Spaces you require, but it’s important to understand that you can only add any one node to a single Space. This means you’ll need to decide whether to use one Space for your team and separate them by War Rooms, or use different Spaces for teams monitoring different parts of your infrastructure.
Dig in with charts, dashboards, and alarms
Nodes view
The Nodes view in each War Room shows you all your key metrics from any number of Agent-monitored nodes. As soon as you claim a node, you will be able to see the operating system, hardware, important services, and more thanks to auto-detection. You decide what’s important for you to keep tabs on, and we provide you the metrics in clean, detailed charts with real-time data. If you need to access the node for any reason, you can do so seamlessly for granular troubleshooting.Each node occupies a single row in the view, beginning with alarm status and operating system. You can define which metrics you want to display by customizing the columns. Change context, title, dimensions to dial in what you need. Filtering and grouping let you further define the view.
Dashboards
We’ve just added the ability for you to create dashboards featuring any chart from any claimed node. This gives you the ultimate flexibility in defining the top-level view for each War Room to help you and your team keep an eye on what’s important. Detect anomalies at a glance with real-time, granular visualizations of the services and applications that make up your critical infrastructure.vid
This enhancement enables you to build real-time dashboards featuring any chart from any claimed node within any of your War Rooms. Set up and edit visualizations for all your systems and applications into a high-level overview or tailor charts to troubleshoot any of your nodes. Setting up a high-level dashboard of your data is a distraction-free means of analyzing metrics, perfect for visibility across your infrastructure. Alternatively, if an anomaly strikes, you have the ability to configure your dashboards to find the root cause. Because we’re building a troubleshooting platform, we’ve added functionality for you to create the same dashboard for different periods of time, enabling you to identify spikes in traffic and seasonal trends. Create your dashboards according to your team’s needs.
To set up and customize dashboards, click on the arrow next to Nodes to navigate to different views of your War Room. From the menu, you can create a new dashboard or navigate to an existing one. As a starting point, you can add interactive charts to monitor your hosts from the Cloud single Node view.
Alarms
You can see active alarms from your nodes in the Nodes view in each War Room. The alarms are color-coded to make it easy to see the status at a glance. Alarms can be the canary in the coal mine when it comes to troubleshooting. When an anomaly strikes, use alarms to navigate through your infrastructure and add relevant charts, from any node, to one dashboard created specifically for troubleshooting that particular issue.In the coming weeks, we’ll add the ability to send alarm notifications by email across your entire infrastructure. Netdata Cloud will receive a notification from any of your nodes with a warning or critical alarm. It will then convert that alarm into an email notification that’s sent directly to you or others you designate on your team, enabling you to know about problems immediately.
Alarms are designed to alert on anomalies, slowdowns, and outages so you never lose sight of the SLAs most critical to your business. It’s simple to set up alarm notifications. Just click a button to benefit from the hundreds of pre-configured alarms that come with every Netdata Agent. We’ve tuned these alarms based on real-world usage by our community of DevOps engineers and SREs. You can even customize alarms using the Agent’s powerful health entity system.
