Let’s talk through a scenario: You have a Linux-based VM running on DigitalOcean (aka a Droplet), and you install Netdata on it using our recommended kickstart script. As the installation process winds down, the Droplet starts up the Netdata Agent’s web server and serves the local Agent web dashboard on port 19999. You navigate to the dashboard using your browser of choice, check out per-second metrics updating in real time in a few of the hundreds of preconfigured visualizations, then realize…
😱 If I can access this dashboard, so can anyone else! My system is already compromised! Let’s break that down a bit. Can anyone access the dashboard? In this specific case, yes. As long as there is no hardware or software firewall/router between the node and the internet at large, anyone can access the dashboard if they know the IP address.
Is the system compromised? Absolutely not. So before you jump back into the DigitalOcean dashboard to destroy your Droplet, let’s take a moment to look into the reality of why Netdata exposes the dashboard on this port by default. From there, you can better understand how to mitigate any possible security concerns, and how this design decision gives you more power over your nodes, not less.
The hows and whys of publicly serving metrics by default
We decided years ago to spin up the web server on port 19999 by default. This decision, and the subsequent discussions, can still be found on GitHub dating back to early 2016. The project was just getting popular for the first time then, and a lot of people were thrilled about visualizing thousands of metrics about their systems and applications for the first time. They also weren’t used to seeing thousands of metrics exposed on a single port.It’s a valid concern (Netdata does not have built-in password authentication) amplified into a myth: It must be insecure!
But Netdata is an opinionated monitoring solution. One of its opinions is that it should be designed to help users go from zero to real-time monitoring in a matter of minutes. Users should be able to install Netdata, load the dashboard, and see meaningful metrics and visualizations without wasting time configuring collectors or organizing metrics into charts.
If Netdata didn’t serve its local dashboard at port 19999 by default, and immediately after installation, you would have to install your own web server before seeing all your real-time metrics. That’s another dozen complex post-installation steps, another dependency to worry about, and another thing to break. Can you imagine our documentation demanding that you install Nginx, copy a long configuration file into sites-enabled, tweak a few files in /etc/nginx (or is it /usr/local/nginx/conf or /usr/local/etc/nginx), buy a domain name, configure DNS, and then start collecting metrics?
That’s not a good real-time monitoring experience. And we’re also of the opinion that your monitoring experience should be really good.
The truth is that Netdata was designed to be both open and safe. In our security design document, we outline the decisions made years ago, and what they mean for your day-to-day Netdata usage. Here’s a summary:
- Netdata is read-only. You can’t tell it to do anything, and it can’t change your system in any way.
- Netdata runs without special/sudo privileges. It couldn’t make changes to your system even if you wanted it to. Hooray for UNIX permissions.
- Netdata only exposes chart metadata and metrics values. Even if an unknown person accesses your system’s Netdata dashboard, they never see raw data or sensitive information about the system itself, such as its OS or kernel versions.
- Collectors are hardcoded and receive no commands from Netdata. Collectors like to gather metrics, and that’s it.
- Data flows unidirectionally, from collectors to the Netdata Agent. Netdata never tries to, and cannot, write data to anything but its own database. It can’t control your applications, alter their configuration files, or even read files it wasn’t transparently designed to do.
sudo to make a system-wide configuration change. They can’t magically read /etc/shadow.Should you let anyone see your node’s dashboard? No! We absolutely recommend that you secure your nodes in any way you or your organization see fit, but Netdata is never going to dictate how you do that. Instead, it works with you to find a solution that’s both secure and feature-rich.Pro-tip:If you haven’t installed Netdata yet, use the --dont-start-it option during installation. This prevents the netdata demon from starting up until you call it explicitly with systemctl netdata start.
bash <(curl -Ss https://my-netdata.io/kickstart.sh) --dont-start-itYou can now take the time you need to configure Netdata according to your needs before you start the daemon and collect metrics.
How to improve Netdata’s security without sacrificing features
While Netdata is indeed opinionated, you can also change its mind quite easily. We now support several configurations that provide rich functionality and full access to real-time dashboards while also providing some more security for those who want to control their infrastructure or are required to by their organization.Netdata Cloud is entirely opt-in, but if real-time cloud infrastructure monitoring with composite charts and Metric Correlations sounds good to you, it’s a great solution to all your potential security concerns. Netdata Cloud receives chart metadata and metrics values over an Agent-initiated, MQTT over secure websocket connection. This connection is secured with a TLS keypair, and because it uses the standard port 443 for encrypted communications, you don’t have to open any inbound ports in your infrastructure.By connecting your node to Netdata Cloud and restricting access to the local Agent dashboard, you reduce exposure while also maintaining all the features about Netdata that you know and love.

The good news is that no matter what path you take, your nodes can always communicate with Netdata Cloud to securely stream metrics values and alarm status to your browser on-demand. It’s the best of both security and usability worlds.
But let’s walk through some of the available routes for that VM running on DigitalOcean.
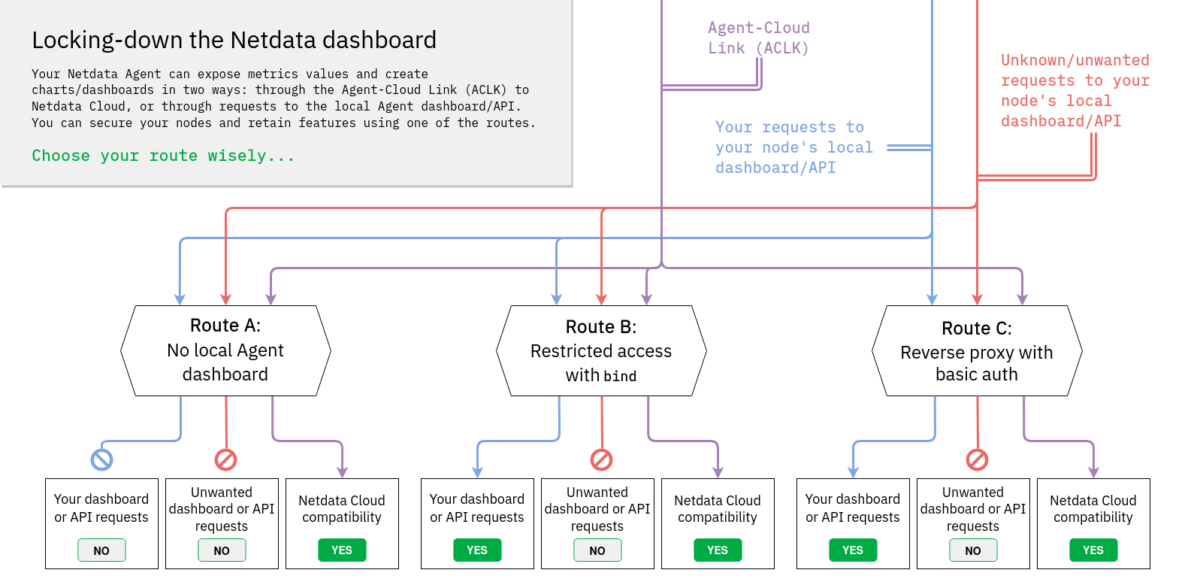
Down route A, you can turn the local Agent dashboard off. In our opinion, this is the best solution because it prevents anyone from accessing your local Agent dashboard at http://NODE:19999, but maintains the Agent-Cloud Link (ACLK) with your Netdata Cloud account for secure on-demand streaming of metrics values to your browser. You can still claim your node(s), view their single-node dashboards, view aggregated metrics together using the Overview’s composite charts, and much more.
- Pros:
- Nothing for anyone to see on port 19999.
- Easiest setup (change a single line in one configuration file!).
- Full compatibility with Netdata Cloud’s dashboards and features.
- Cons:
- No ability to view the local Agent dashboard.
- No API.
bind option to restrict dashboard access. With access lists, you can control exactly who, and from what source, someone can view your local Agent dashboard. This route is ideal for those who want to secure the local Agent dashboard from unauthorized access and see everything in Netdata Cloud, but also want the flexibility to build custom local dashboards or power other business processes with Netdata’s API.Learn how to take route B.- Pros:
- Leave the local Agent dashboard running, but restricted to only known networks or trusted external IPs.
- Full compatibility with Netdata Cloud’s dashboards and features.
- Cons:
- Requires more upfront configuration and knowledge of access lists.
- Requires a relatively static IP or management LAN.
- Pros:
- Leave the local Agent dashboard running, with optional password authentication.
- Leverage a dedicated web server’s additional features and configuration options.
- Optional easy HTTPS/SSL with Let’s Encrypt.
- Full compatibility with Netdata Cloud’s dashboards and features.
- Cons:
- Requires the most upfront configuration, installation of new packages, and knowledge of web server configuration.
- Requires some knowledge of TLS keypairs.
- Often requires a domain name to associate with the node, which in turn requires some DNS configuration.
Choose your own adven… monitoring setup
A monitoring solution should slot seamlessly into the existing strategy to organize and secure both individual nodes and the entire infrastructure, not advocate for one route or another. We have no desire to tell our users how to do that work, nor are we qualified to offer best practices for your particular environment.And now that you’re educated about the routes available to you, you have all the know-how to make the best decision for your infrastructure. You could even choose to leave port 19999 exposed by default and choose to secure your nodes in other ways, which is what we’ve done with our own demo server.
Whichever way you go, Netdata is ready to meet you halfway with the same per-second metrics, instant visualizations, and powerful infrastructure monitoring tools in Netdata Cloud. What some used to call an insecure default, we can now name correctly: a configurable default that emphasizes immediate results and puts trust in our users.
